Okanagan/Shuswap Housing Market – August/September 2016
Published: October 8, 2016It’s been a typical late summer and early fall. Everyone was enjoying the last days of summer and vacation and now it’s back to work and school. August 2016 real estate sales were fewer across the Okanagan/Shuswap region compared to July. Overall, sales dropped about 2% last month – but don’t let that fool you, sales were up 25.8% over August of last year.
Real estate sale prices in the Okanagan/Shuswap followed a similar trend, up compared to last year, but down compared to last month. The market is slowly moderating, but until we see more new listings inventory there will be continued pressure in the market.
Families with children are by far our largest group of real estate shoppers. Followed by empty-nesters or retired buyers. Those already residing in the Okanagan/Shuswap are still our largest buyer group.
The B.C. government’s new Property Transfer Tax (PTT) for foreign buyers purchasing in Metro Vancouver so far has not had a significant impact on our local market, remaining consistent at roughly 2% of total purchases. Buyers from the Lower Mainland make up about 18% of real estate purchases in the Okanagan/Shuswap, Alberta buyers 9% and buyers from elsewhere in B.C. 7%.
If you’d like to read our blog on the new 15% tax for Metro Vancouver, click here: New Property Transfer Tax – B.C.’s Real Estate Market
North Okanagan Real Estate Market (Vernon, Coldstream, Armstrong & Areas)
Stats for August 2016 Compared to August 2015

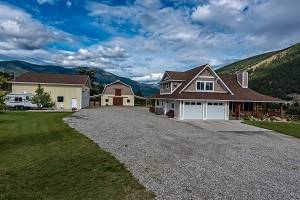
4530 Cedar Hill Road, Salmon Valley
- Overall sales up 51% to 248 units.
- Single Family home sales up 37% to 122 units.
- New listings, 372 units, up 1%.
- Active listings 1,712, down 22%.
- Single Family homes listed, increased 1% to 139 units.
- Average days to sell 102, down from 124 days, down 17%.
- Average price, single family homes, $434,434 up 3% from $420,812.
Shuswap Real Estate Market (Salmon Arm & Mabel Lake Areas)
Stats for August 2016 Compared to August 2015

175 TransCanada Highway, Sicamous
- Overall sales up 35% to 172 units.
- Single Family home sales up 21% to 74 units.
- New listings, 218 units, up 14%.
- Active listings 1,315, down 15%.
- Single Family homes listed, increased 20% to 77 units.
- Average days to sell 149, up 4% from 143 days.
- Average price, single family homes, $55,218 up 11% from $320,293.
Source: Okanagan Mainline Real Estate Board Statistics:
North Okanagan: North Okanagan Monthly Statistics, August 2016
Shuswap: Shuswap / Revelstoke Monthly Statistics, August 2016

