
Okanagan/Shuswap Housing Market – May/June 2016
Published: July 8, 2016Breaking real estate records in the Okanagan-Shuswap! From Peachland to Revelstoke, we’re seeing rising prices and short turn-around times between listing and selling. Hard to believe a year ago the North Okanagan-Shuswap real estate market was slow.
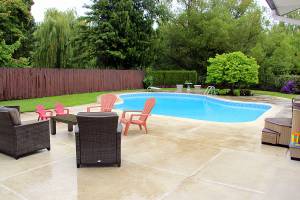
8315 Kalavista Drive, Coldstream, BC
Nothing has been straight forward this past month. Multiple offer scenarios, complex negotiations, and tight timelines have become ‘the norm’. It’s kept us on our toes! Fortunately we were ready to navigate these fast times with a full team of Realtors, customer support, listing coordinators and marketers, conveyancers, and a seasoned Managing Broker.
Short housing supply is having an effect on the market. Demand is being driven by a few factors, but the experts tell us population growth is a big one here in the Okanagan. Interesting stuff. Personally, we’re a little surprised. The drop we all expected from Albertans buying retirement and recreation properties hasn’t been as significant as we anticipated, any void is quickly being filled by buyers from the lower mainland.
What do the stats say? Comparing May 2016 to the same month last year, in the entire Okanagan-Shuswap, overall residential sales are up 35.5%, the number of active listings have dropped 19% and MLS price rose 15% taking the local average from $459,595 to $486,636… Keep in mind, when we talk about “average” price we’re pretty hard pressed to find an abundance of homes in that actual price range.
Here’s the latest stats available specifically for May for the Vernon Area and Shuswap. We’re looking forward to seeing what the stats will say for June!
North Okanagan Real Estate Market (Vernon, Coldstream, Armstrong & Areas)
Stats for May 2016 Compared to May 2015
3927 Pothecary Place, Armstrong, BC
- Overall sales up 25% to 284 units.
- Single Family home sales up 31% to 153 units.
- New listings, 447 units, down 4%.
- Active listings 1,850, down 14%.
- Single Family homes listed, dropped 7% to 204 units.
- Average days to sell 101, not much change from 102 days.
- Average price, single family homes, $419,275 up 13% from $370,770.
Shuswap Real Estate Market (Salmon Arm & Mabel Lake Areas)
Stats for May 2016 Compared to May 2015

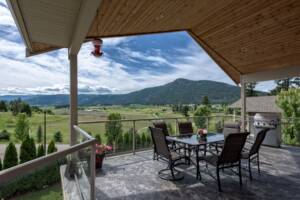
1080 54 Ave NE, Salmon Arm, BC (Shuswap Lake)
- Overall sales up 20% to 164 units.
- Single Family home sales up only 2% to 73 units.. but sales for the year to date are up 10%
- New listings, 306 units, up 4%.
- Active listings 1,370, down 10%.
- Single Family homes listed, dropped 11% to 112 units.
- Average days to sell 117, down 20% from 146 days.
- Average price, single family homes, $380,169 up 8% from $351,629.
Source: Real Estate statistics provided by the Okanagan Mainline Real Estate Board http://www.omreb.com/